Project Definition
Project Name: iTrack Heavy Duty Truck Tire IoT Application
Role: Lead UX/UI Designer
Tools Used: Figma, Sketch, InVision, UserTesting
Summary:
The iTrack platform was designed to monitor and manage the tire pressure and temperature of heavy-duty trucks in real-time using IoT technology. The application provided fleet managers and drivers with real-time insights into vehicle safety and maintenance, accessible through mobile and tablet devices.
Problems and Solutions
Fleet managers and truck drivers needed a system to efficiently monitor tyre pressure and temperature in real time to prevent breakdowns and ensure vehicle safety. The challenge was to create an intuitive, mobile-first interface that delivered real-time data and alerts for better tyre management and reduced maintenance costs.
Based on the user interviews and competitive analysis, the key findings are:
- Real-time monitoring was critical to preventing breakdowns due to under-inflated or overheated tyres.
- Users required a simple interface to quickly assess all truck tyres’ condition.
- There is a need for automated alerts and reporting tools for both fleet managers and drivers.
These insights informed the need for a clear, real-time interface and an alert system for tyre management.
The Approach
Wireframes & Prototypes:
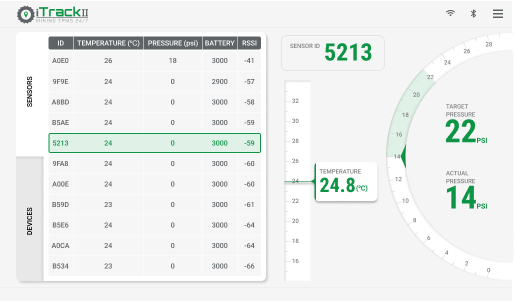
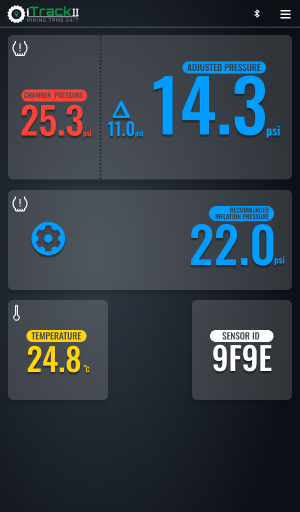
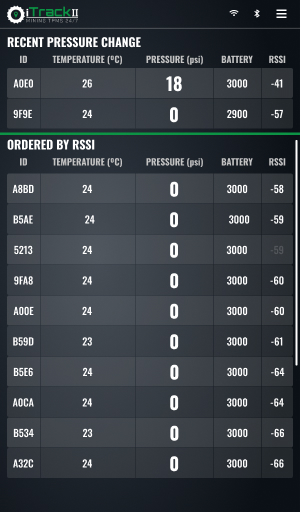
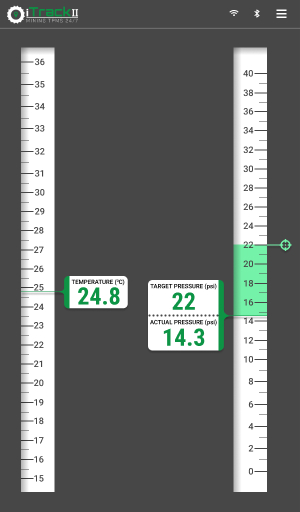
Low-fidelity wireframes were created to map user flows, focusing on real-time data visibility and ease of navigation. High-fidelity prototypes featuring responsive design for tablet and mobile interfaces were then developed.
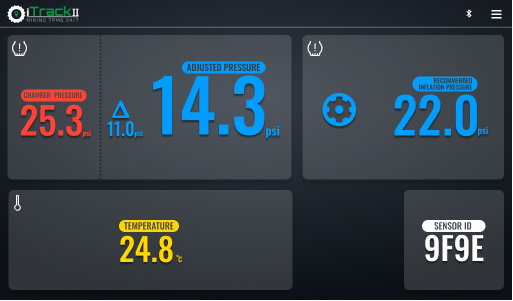
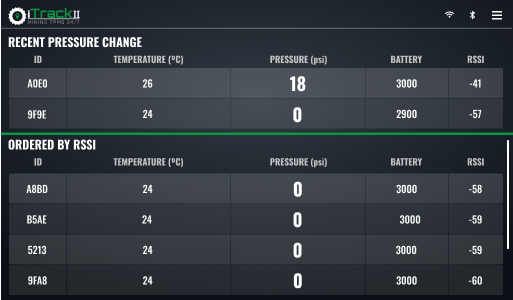
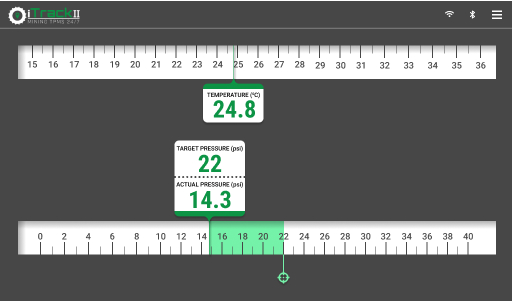
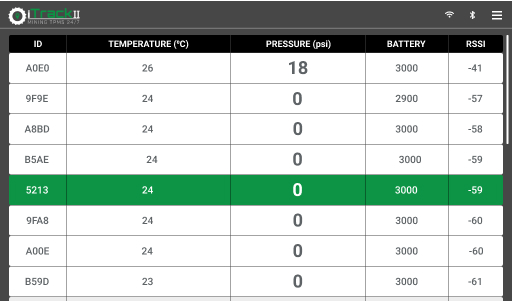
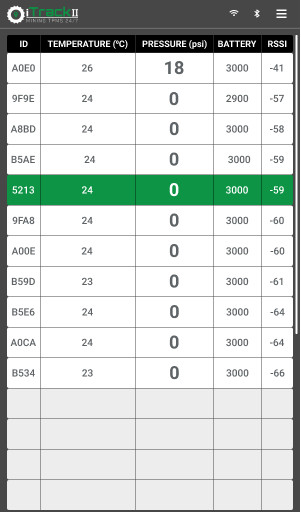
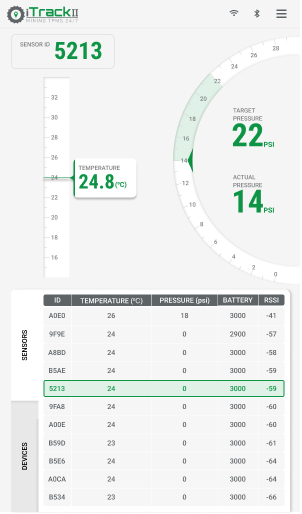
- Real-Time Data Visualisation: Real-time tyre pressure and temperature data were prominently displayed, allowing users to track vehicle safety quickly.
- Alert System: Automatic alerts were integrated to notify users of critical tyre issues, such as under-inflation or overheating.
- Historical Reports: Fleet managers could access detailed historical data for each tyre, aiding in preventive maintenance.
UI Design:
The design featured a minimal, data-focused interface with easy-to-read metrics, ensuring drivers and fleet managers could make quick decisions. The colour scheme used intuitive visual cues (green, yellow, red) to indicate tyre health.
We tested the app interface (interactive prototype) with fleet managers and truck drivers, refining the real-time data display and alert functionality. Feedback helped improve data clarity and simplify interaction on mobile devices.
Impacts
- Reduced Downtime: Real-time monitoring created visibility about tire-related breakdowns.
- Improved User Efficiency: Based on stakeholder feedback, the app’s interface simplified and reduced the time needed to assess tyre conditions.
- Increased User Satisfaction: Stakeholders highlighted the real-time alerts are the most valuable feature.
